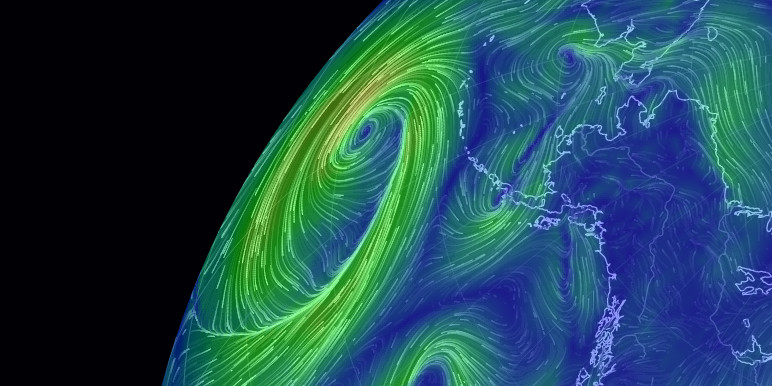
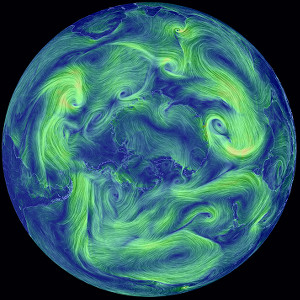
earth
uma visualização das condições de climaticas globais
boletins gerados por supercomputadores
atualizados a cada três horas
superfície estimatida do oceano
atualizadas a cada cinco dias
temperaturas de superfície do oceano e
anomalia da média diária (1981-2011)
atualizada diariamente
ondas do oceano
atualizadas a cada três horas
aurora
updated every thirty minutes
 Adquira obras de arte do Point.B Studio para ajudar a apoiar este site
licensing
contact inquiries@nullschool.net for licensing or other questions
translations
help translate this site by visiting translate.nullschool.net
| Comunidade | Página do Facebook |
| Autor | Cameron Beccario @cambecc |
| Versão gratuita do código fonte | github.com/cambecc/earth |
| Módulos |
D3.js node.js |
| Dados meteorológicos |
GFS (Global Forecast System) EMC / NCEP / NWS / NOAA |
| Dados de correntes do oceano |
OSCAR Earth & Space Research |
| Temperatura de Superfície do Mar |
RTGSST (Real Time Global Sea Surface Temperature) MMAB / EMC / NCEP / NWS / NOAA |
| Ondas do oceano |
WAVEWATCH III MMAB / EMC / NCEP / NWS / NOAA |
| Aerossóis e química |
GEOS-5 (Goddard Earth Observing System) GMAO / NASA CAMS (Copernicus Atmosphere Monitoring System) Copernicus / European Commission + ECMWF |
| Aurora |
OVATION SWPC / NCEP / NWS / NOAA Processing script written by Stephanie Hamilton (profile) |
| Decodificador de GRIB/NetCDF | UCAR/Unidata THREDDS |
| Dados geográficos | Natural Earth |
| Hospedagem |
CloudFlare Amazon S3 |
| Fontes |
M+ FONTS Google Noto Fonts Font Awesome |
| Translation Management | OneSky |
| Escalas de Cores |
ColorBrewer2.org Kindlmann Linear Luminance MYCARTA Dave Green's cubehelix |
| Borboleta Waterman | watermanpolyhedron.com |
| Protótipo | 東京風速 |
| Inspiração | HINT.FM wind map |
atmospheric pressure corresponds roughly to altitude
several pressure layers are meteorologically interesting
they show data assuming the earth is completely smooth
note: 1 hectopascal (hPa) = 1 millibar (mb)
| 1000 hPa | 00,~100 m, condições ao nível do mar |
| 850 hPa | 0~1,500 m, camada limite atmosférica, baixa |
| 700 hPa | 0~3,500 m, camada limite atmosférica, elevada |
| 500 hPa | 0~5,000 m, vorticidade |
| 250 hPa | ~10,500 m, corrente de jato |
| 70 hPa | ~17,500 m, estratosfera |
| 10 hPa | ~26,500 m, ainda mais estratosfera |
A camada de "Superfície" representa as condições no terreno ou do nível da água
esta camada segue os contornos das montanhas, vales, etc.
overlays show another dimension of data using color
some overlays are valid at a specific height
while others are valid for the entire thickness of the atmosphere
| Vento | velocidade do vento na altura especificada |
| Temp | temperatura na altura especificada |
| UH | umidade relativa na altura especificada |
| WPD |
Densidade instantânea do vento measure of power available in the wind: ½ρv3, where ρ is air density and v is wind velocity |
| TAP |
Total Precipitable Water quantidade total de água em uma coluna de ar que se estende do solo ao espaço |
| TAN |
Total de água na nuvem quantidade total de água nas nuvens em uma coluna de ar da terra para o espaço |
| 3AP |
Acúmulo de precipitação em 3 horas quantidade de precipitação nas próximas três horas |
| CAPE |
Energia Potencial Convectiva Disponível indica o empuxo do ar, uma medida da instabilidade atmosférica e indicador de tempo severo |
| MSLP |
Pressão ao nível do mar pressão de ar reduzida ao nível do mar |
| MI |
Índice de Desconforto Térmico perceived air temperature as combination of heat index and wind chill |
| TSM |
Temperatura de Superfície do Mar temperatura na superfície do oceano |
| ATSM |
Anomalia de Temperatura na Superfície do Mar diferença na temperatura do mar de média diária durante anos 1981-2011 |
| ASO |
Altura Significativa de Onda aproximadamente igual a altura de onda, como estimado por um "observador" |
| pCO2 | Sea Surface CO2 Partial Pressure |
| FGCO2 |
Sea-Air CO2 Flux Density the rate of movement of molecules across a unit area |
| COsc |
Concentração de Monóxido de Carbono Superficial Uma fração de monóxido de carbono presente no ar da superfície da terra |
| CO2sc |
Concetração de Dióxido de Carbono na Superfície uma fração de dióxido de carbono presente no ar da superfície terrestre |
| SO2sm |
Massa de Dióxido de Enxofre Superficial amount of sulfur dioxide in the air near the earth's surface |
| DUex |
Extinção de pó the aerosol optical thickness (AOT) of light at 550 nm due to dust |
| SO4ex |
Extinção de sulfato the aerosol optical thickness (AOT) of light at 550 nm due to sulfate |
| PM1 |
Particulate Matter < 1 µm mass of atmospheric particles with a diameter less than 1 micron |
| PM2.5 |
Particulate Matter < 2.5 µm mass of atmospheric particles with a diameter less than 2.5 microns |
| PM10 |
Particulate Matter < 10 µm mass of atmospheric particles with a diameter less than 10 microns |
sobre ondas do oceano
Significant Wave Height is the average height of the highest 1/3 of waves at a particular point in the ocean. There's a great writeup here describing what this means.
Peak Wave Period is the (inverse) frequency of the most energetic waves passing through a particular point, whether wind generated or swells. Certainly, there are many more groups of waves moving through an area, each in different directions, but trying to show them all rapidly becomes complex. Instead, we show the one wave group contributing the most energy. This has the effect, though, of creating "boundaries" between regions of ocean where the #1 wave group suddenly switches to second place. Often these boundaries represent swell fronts, but other times they are just artifacts of the ranking mechanism.
sobre concentrações de CO2
for dates earlier than 2017-01-24 04:30 UTC
While implementing the visualization of CO2 surface concentration, I noticed the NASA GEOS-5 model reports a global mean concentration that differs significantly from widely reported numbers. For example, from the run at 2015-11-23 00:00 UTC, the global mean is only 368 ppmv whereas CO2 observatories report concentrations closer to 400 ppmv. GEOS-5 was constructed in the 2000s, so perhaps the model does not account for accumulation of atmospheric CO2 over time? This is simply speculation. I am just not certain.
To bring the GEOS-5 results closer to contemporary numbers, I have added a uniform offset of +32 ppmv, increasing the global mean to 400 ppmv. This is not scientifically valid, but it does allow the visualization to become illustrative of the discussion occurring today around atmospheric CO2. Without question, I would welcome a more rigorous approach or an explanation why the GEOS-5 model produces the data that it does.
From 2017-01-24 04:30 UTC, this adjustment is no longer necessary because GEOS-5 appears to have been upgraded.
reclamação
GEOS-5 data (covering all Chem and Particulates layers) comes with the following disclaimer: Forecasts using the GEOS system are experimental and are produced for research purposes only. Use of these forecasts for purposes other than research is not recommended.
sobre aerossóis e extinção
An aerosol is air containing particles. Common particles are dust, smoke, soot, and water droplets (clouds). These particles affect sunlight primarily through absorption and scattering, which combine to reduce the amount of light reaching the ground. This loss of light as it passes through the atmosphere is called extinction.
One common measure of extinction is aerosol optical thickness (AOT), which is (the log of) the ratio between the power of incoming light and the power of transmitted light. This helps us understand how "thick" the air is with particulates.
atalhos do teclado
| e | mostrar o menu |
| escape | feche a caixa de diálogo/menu |
| k | ir para a frente |
| shift-k | avançar vários passos |
| j | voltar vários passos |
| shift-j | voltar vários passos |
| n | ir para (data mais recente) |
| shift-c | show the date selection calendar |
| i | subir um nível de pressão |
| shift-i | subir para a estratosfera |
| m | descer um nível de pressão |
| shift-m | descer para a superfície |
| g | alternar a grade ligar/desligar |
| p | alternar a animação ligar/desligar |
| shift-h | habilitar/desabilitar modo de alta definição |
tradutores
1599763839 1992pb 2451158917 afropolakwot agagey Aleksander Alexander Kirilov Alexey Dmitriev Alexey Korsakov AlexOrlovets Anderson Porto Andre Lz Andrea de Franco Andrew Pedrini Andrey Bagmanov Antonpek arquerogonza Artur Wisniewski ashawesoman ashvin.j.sherathiya astrostrong asveruz atom benji.poirier bgij bidulem3 Birg3r Bohuslav Šín Bram Versteeve Bryan carina.bringedal carlofrc Cassiel Bclamson Ching-ping Yu Christian Leroux contact cuxcoll Daniel Bartsch Daniel Isak Marinosson Daniel Pawlowski Daniel Rakoczy danielruiz1636 Darlite davalenciano98 Davide Carlier Denat250 deus.05 Dimitris T. Papadimitriou dlo.daniel Dominic Douglas dsantosgtm e Eason Huang egarpunov elier.pila Eric Kim essaii32 estefilippini fantasy_lcl farrasoctara Felipe Faria florian-lerch franci00 FranklinZhang Frederik T. de Ridder fthmiln georg.loesel gherlainfo giacomo.gerosa Gian Centeno giospud gonzalo.ag88 gporter.seadog graceang graham.rimmington grol2901 Hebel holgersson Hyung Wook Jung Ichiro Wang Ignacio Sanz iii1212 InfoSecOne Jae Soo Park Jiří Batelka Joanna Rinne Joao Correia jocelot Jomari Joseph Barrera Jonathan Yang Jose A. Frias Morales juanpaexpedite kai.s.mueller Karol Sapiński Kiyun Jeon kjetil.hoiby kty5663 ku5an2901 laurapaccini leandro1212 leticia.tahnee lretamal Luboš Motl m_strugale marcello.carreira marco.prosdocimo Mark markeletona Markus Schley Martine Bolzinger Matt Tang Mattia Raffa mavilesilva melfi Melissa Ortiz Massó Meow Wang mgb Michael Purer Michael Michel Rivero mikami_1966.1118 mikele.fit95 Miquel Bayo Moreno mir597 MirageF1AZ Miroslaw Lisiak Mohannad Alahmadi nando nunolava1998 Oğuzhan Arı Olivier OLS-RU P_A_N_D_A_M_A_N Paul Bachem Paweł Kowalczyk pdobrev Personim Intaned Philippe Jabet Plamen Dobrev ProffLex Rafael Nonato Bassora rajeshgodvani RaskiPL reyfran8 Riccardo Monfardini robertrosalex Roger Helman Roller978 rosariainpo Russel Schwartz santiago.giraldoc sapan021 sarogrom Seongmin Park september43 Seregalsv Serega silverhaze030 Simone Dragoni siudzin98 skyneon77 sombrasbaul Somil Thesia Stephen Flynn Steven Sunny Miu Tayseer M Alhibshi Telmo John tenderstart thanhhuyenlth Thomas Middelveld Thorsten Schleicher tigormal tigra200sx Tomasz Waligóra torstenleibrich ulaszewski.bartosz ultordima Vasily Tarasenko vhc1967 Víctor Velarde Vu Thuong wasted webfreelance Wonmin Jeong wtlovergirl xesmedic xorpid xrdeem xsqz yaawwad Yauhen Bahashou youngjune4498 Youngmin Jeon Yukun Chen zackcaussy Zulus Οverlord Александр Попов Вячеслав Епиков 피시 潘柏綸


Selected for inclusion in the Climate Literacy and Energy Awareness Network (CLEAN) collection of educational resources.
Os dados usados no GEOS-5 foram fornecidos pelo escritório de assimilação (GMAO) na NASA Goddard Space Flight Center e modelagem Global através do portal de dados on-line no centro da NASA para a simulação de clima
Generated using Copernicus Atmosphere Monitoring Service Information 2017-2020. Neither the European Commission nor ECMWF is responsible for any use that may be made of this information.
Landschützer, Peter; Gruber, Nicolas; Bakker, Dorothee C. E. (2017). An observation-based global monthly gridded sea surface pCO2 product from 1982 onward and its monthly climatology (NCEI Accession 0160558). Version 4.4. NOAA National Centers for Environmental Information. Dataset. https://doi.org/10.7289/V5Z899N6. [2019-03-27]
clima e oceano de dados gerados a partir de modelos numéricos
earth.nullschool.net não garante a precisão das informações
Copyright (c) 2019 Cameron Beccario